Infoblox threat intelligence is derived from a large number of sources, using a wide range of techniques, to offer our customers the best security possible. We have just released a white paper describing a graphing technique we use to identify malicious campaigns from email spam. This paper is the first in a new Tools of the Trade series. These algorithms allow us to more easily and accurately identify malicious activity and secure our customer’s networks.
Malicious spam, often referred to as malspam, uses file attachments or embedded hyperlinks (URLs) to infect victims. The email recipient must either open the file or click on the URL, and often may need to enable macros or editing on their machine for the attack to continue. Threat actors prey on people’s hopes and fears, as well as inexperience with computer security, with a variety of lures, including spoofed documentation, promises of financial gain or threats of blackmail to trick victims into taking these steps. They gain access to the user’s machine and often their private information and the consequences can be quite significant. One such example is the December 2019 Emotet attack that brought Frankfurt, Germany to a halt [1]. Organized thieves also leverage crises like the Coronavirus pandemic [2] or Black Lives Matter protests [3] as a means to manipulate victims and steal their financial information.
Email spam is therefore a rich source of data for threat hunting and research. However, the massive volume of spam, the staged approach of the threat actors and their constant adaptation to avoid detection make it difficult to isolate malicious indicators. Traditional approaches leverage algorithms, both heuristic and machine learning, to identify suspicious code or content in websites. In some cases, automation is able to definitively determine whether a given attachment or URL is malicious, but more often it will lead to large quantities of generically suspicious emails requiring manual review. There are not enough human resources to manually evaluate all of these results.
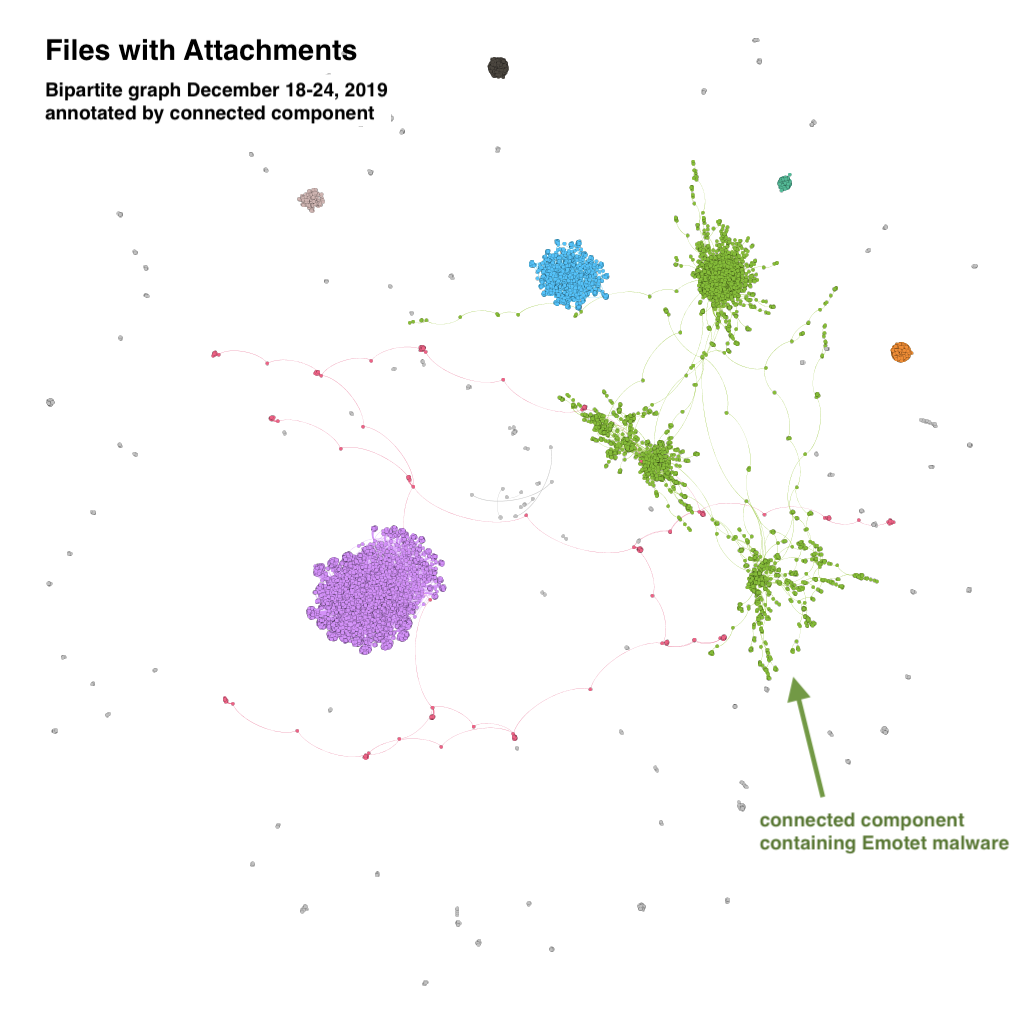
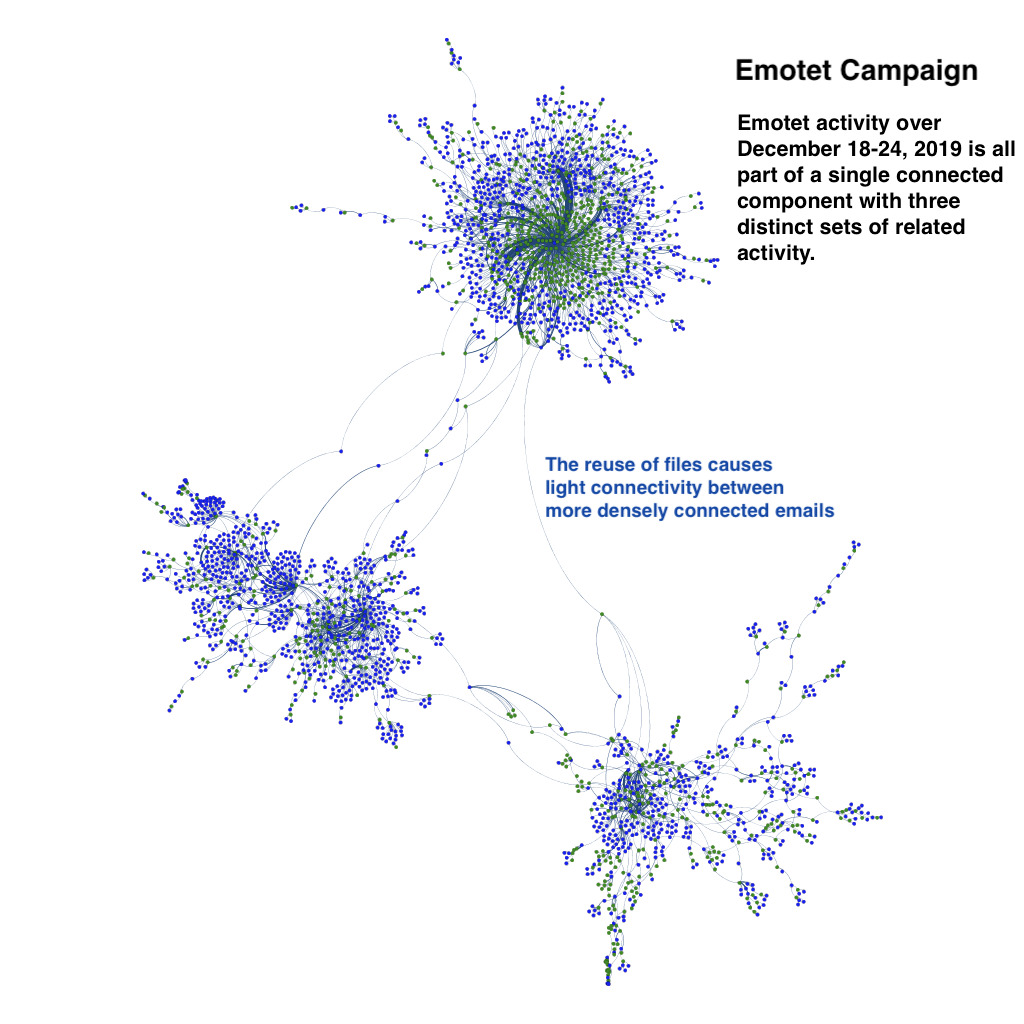
As we discuss further in the paper, we use graphs constructed from email header data and algorithms to distill all of the spam into likely campaigns. In Figure 1, we show one such example, highlighting how different emails are clustered together. Figure 2 shows a portion of this same graph, isolating an Emotet campaign. These approaches reduce the amount of data requiring manual analysis by up to 90 percent. Read all about it in Distilling Campaigns in Spam.

Figure 1. A bipartite graph derived from email headers and colored by connected components.

Figure 2. A subgraph of that shown in figure 1 limited to an Emotet campaign.
[1] Kaspersky ICS-CERT, German cities under attack by Emotet botnet, 24 December 2019, https://ics-cert.kaspersky.com/news/2019/12/24/emotet-attacks-german-cities/
[2] US Center for Disease Control, COVID-19-Related Phone Scams and Phishing Techniques, 3 April 2020, https://www.cdc.gov/media/phishing.html
[3] E. Patterson, BLM Themed Malspam Delivers Trickbot Trojan, 1 July 2020, https://insights.infoblox.com/threat-intelligence-reports/threat-intelligence–77


