Authors: Brent Eskridge, Laura da Rocha, Renée Burton
Note: This article is intended to be a short digestible introduction to the whitepaper found here.
The internet is home to funny pet videos, malware that steals your bank account information, and everything in between. Often, savvy internet users intuitively understand the risk of visiting a particular website or clicking on a link in an email announcing they have won a fantastic prize. Unfortunately, quantifying this intuitive process of identifying reputation or risk so it works at scale is challenging. If 30% of the domains found in a given top level domain (TLD) are malicious, is that bad? If so, how bad is it? It’s hard to say without relative information about other TLDs. Similarly, what does it mean to say a TLD is of high risk?
Today Infoblox is releasing a new algorithm for scoring reputation. Our approach is designed to reduce ambiguity, provide a single standard, and make meaningful comparisons between items straightforward. We are releasing a whitepaper that contains an in depth explanation of the algorithm and its theoretical foundations. The paper uses the process of determining the reputation score of top-level domains (TLDs) as a running example, but the algorithm can be applied to any data set and use case that meets the minimal data requirements. To help others apply this algorithm to their data and use cases, we are also publicly releasing a python implementation of the algorithm.
Algorithm Overview
The reputation scoring algorithm uses only two pieces of information: the total number of items and the number items meeting a specific criteria. For the TLD reputation use case, these values would be the total number of domains observed in the TLD and the number of observed malicious domains in the TLD. The algorithm uses these two values to ultimately produce an ordinal score from zero to ten; that is [0:10]. A score of five (5) is interpreted as the expected, moderate score, and represents the mean score over all the data. In the TLD reputation use case, the TLD com received a score of 5 for the month of August 2022, meaning it had close to the average number of observed malicious domains relative to the total number of domains in the TLD. While the com TLD may be home to a lot of threats, the score tells us that the level of threat is fairly average in comparison to all other TLDs. Scores below five had a lower-than-average percentage of malicious domains and scores above five had a higher-than-average percentage.
The ordinal scores are calculated based on the number of standard deviations away from the mean that the data lies, which describes the spread of data about the mean, which, in this case, is assigned a score of five. In the algorithm, a score of four (4) indicates that the item is one standard deviation below the mean and a score of six (6) indicates that the item is one standard deviation above the mean. Scores of three (3) and seven (7) are two standard deviations away from the mean, and so on. To simplify scoring, the number of standard deviations is rounded to the nearest whole number, as is shown in the figure below.
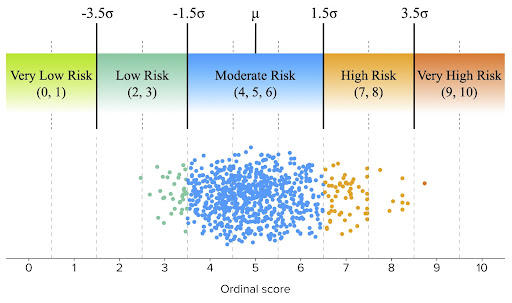
These ordinal scores are used to assign labels that simplify analysis. One would expect about 68% of all data to be within one standard deviation of the mean, so the scores of four, five, and six are all labeled as “Moderate Risk”. Scores of two and three are labeled as “Low Risk”, since data with these scores are 2-3 standard deviations below the mean. In the TLD use case, the TLD .edu had a score of three (3) for the month of August 2022, meaning it had far fewer observed malicious domains relative to the total number of domains than other TLDs. On the other end, scores of seven and eight are labeled as “High Risk” since data with these scores are two to three standard deviations above the mean. For example, the TLD .click had a score of 7 for the month of August 2022 since it had a far higher percentage of malicious domains than most of the other TLDs.
At the extremes lie the “Very Low Risk” and “Very High Risk” labels. By the statistical nature of this algorithm, only a small number of data types (such as TLDs) will have these extreme risk scores. However, the particular use case or biases in the ways data is gathered can have a profound impact on the assignment of these labels. For example, in the TLD use case, we simply may not observe any malicious domains in a given TLD. The TLD may have malicious domains, but they simply aren’t present in the data. This won’t be the case for larger TLDs such as .com or .net, but with the rapid increase in recent years of TLDs with relatively few domains, it happens more often than one would expect. In these cases, the TLD is assigned a risk score of zero (0). Conversely, there may be TLDs in which every observed domain is malicious. While this situation occurs far less frequently, we have encountered it. In these situations, the TLD is assigned a risk score of ten (10).
The algorithm can be used in situations where the number of values for a given piece of data varies considerably within the data set (e.g., the number of observed domains in a TLD). This does not mean, however, that the algorithm assigns equal confidence to all scores. If a piece of data has too few values, such as the total number of observed domains in the TLD use case, the algorithm still assigns a score, but labels the resulting score as low confidence, giving users the option of including the data in further analysis if they want.
Future Opportunities
While assigning risk scores to TLDs was used as a case study, the reputation scoring algorithm can be applied to a wide variety of problems and use cases. Infoblox customers can find TLD and nameserver reputation in Dossier today, while domain registrar and other reputation scores will be added in the future.
The Threat Intelligence Group’s whitepaper on the algorithm includes a detailed explanation of the algorithm and an explanation of how it was used to identify high-risk, high-confidence TLDs. By sharing this algorithm publicly, it is our hope that others can apply it to their data and use cases in cybersecurity and beyond. To download the whitepaper, click here. A minimum working example of the algorithm can be found in our public GitHub repository here.


