The year 2020 was unprecedented in many ways and our lives will be forever changed by the COVID-19 pandemic. One of the interesting impacts of the pandemic has been its influence on the Internet, and this effect can be observed in the historical IPv6 traffic volume measurements. From various sources providing Internet traffic volume statistics, we can see the difference when people are at their places of work using IPv4-only (unfortunately, many enterprises lag in IPv6 adoption) versus when they are working remotely or at home relaxing and using IPv6-enabled Internet access.
Google’s IPv6 Statistics
Google’s international footprint gives them a broad perspective of the whole Internet. Google uses their global platform to calculate the amount of IPv6 usage they see on the Internet. Google’s “IPv6 Adoption Statistics” page is popular among IPv6 proponents because it provides a global view of IPv6 usage.
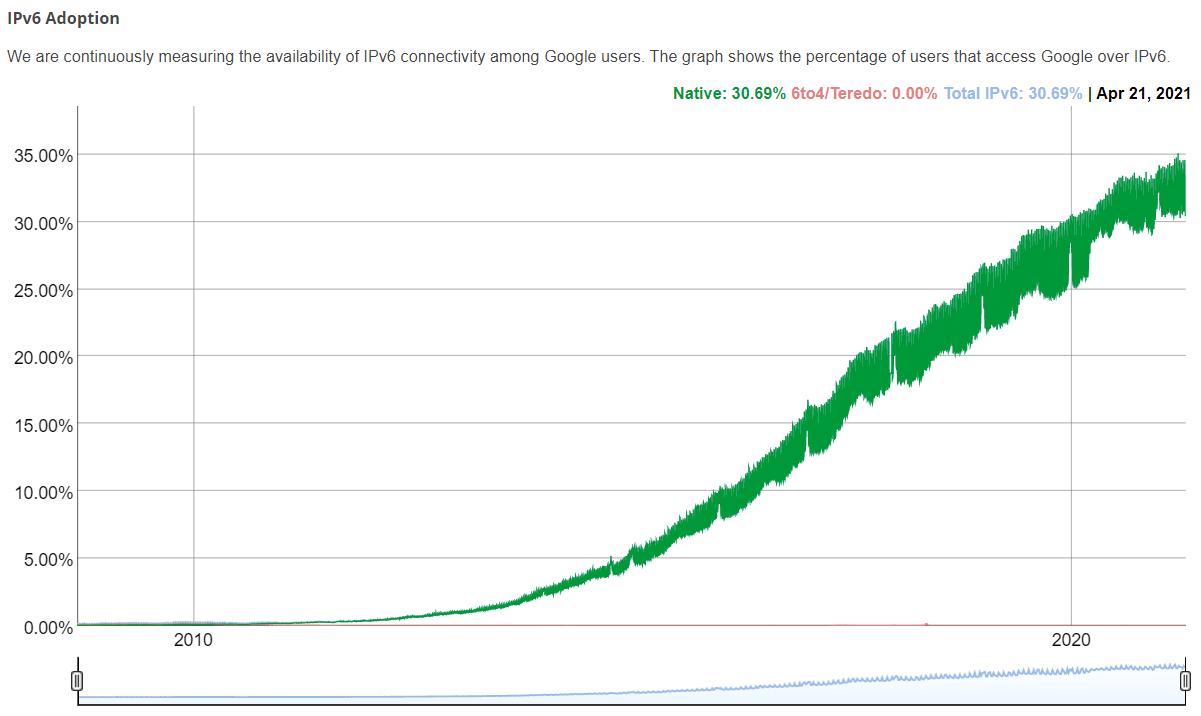
The Google IPv6 Adoption Statistics graph shows an oscillation (variation in the green line) that gets larger every year. This is the weekly delta between IPv6 usage when people are in the IPv4-only enterprise workplace (the low point in the oscillation) without IPv6 Internet access, and at home using residential broadband or their mobile devices with IPv6 Internet access (the high point). Also, during the end-of-year holidays, the IPv6 usage peaks rise when people take vacations and are using their own IPv6 Internet connectivity.
This green-line weekly oscillation pattern has been termed the “Enterprise Effect”. Veronika McKillop described “The Enterprise Effect” in her presentation to the UK IPv6 Council in January 23, 2018 (slide 15).
If we use the slider bars on the bottom of the Google IPv6 Statistics graph to change the timeframe to the most recent year, we can see how this graph has changed with COVID-19 pandemic.
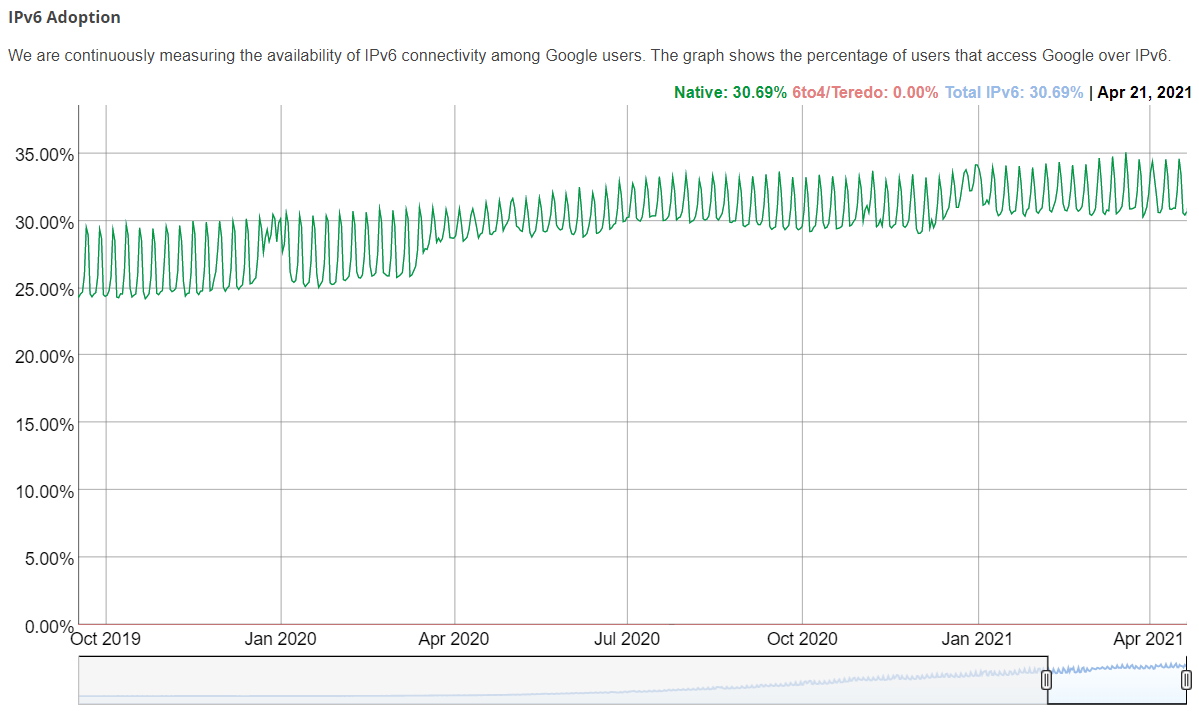
We can observe that, starting in March 2020, the COVID-19 lockdowns began and people were not going into the IPv4-only enterprise. After March the IPv6 “valleys” were nearly at the same point as the “peaks” in February. The amount of IPv6 usage rose nearly 5% in about four months. Then, by the fall of 2020 we can see the green-line oscillation pattern growing as people were slowly returning to work. During the 2020 end-of-year holiday season we can see the rise in IPv6 usage, and now in early 2021 we observe the return of the “Enterprise Effect”. (We discussed this phenomenon in “IPv6 Buzz 051: How The Work-From-Home Movement Affects IPv6 And The Internet“.)
Akamai IPv6 Statistics
One simple way to enable IPv6 access to your legacy IPv4-only web site is to use a Content Delivery Network (CDN) service like Akamai’s. Akamai’s global content distribution system gives them a comprehensive view of the world’s Internet traffic patterns. Akamai has been publishing their “The State of the Internet” report for decades, describing trends and observations from their global perspective. Akamai also has an “IPv6 Adoption Visualization” site showing IPv6 usage by country.
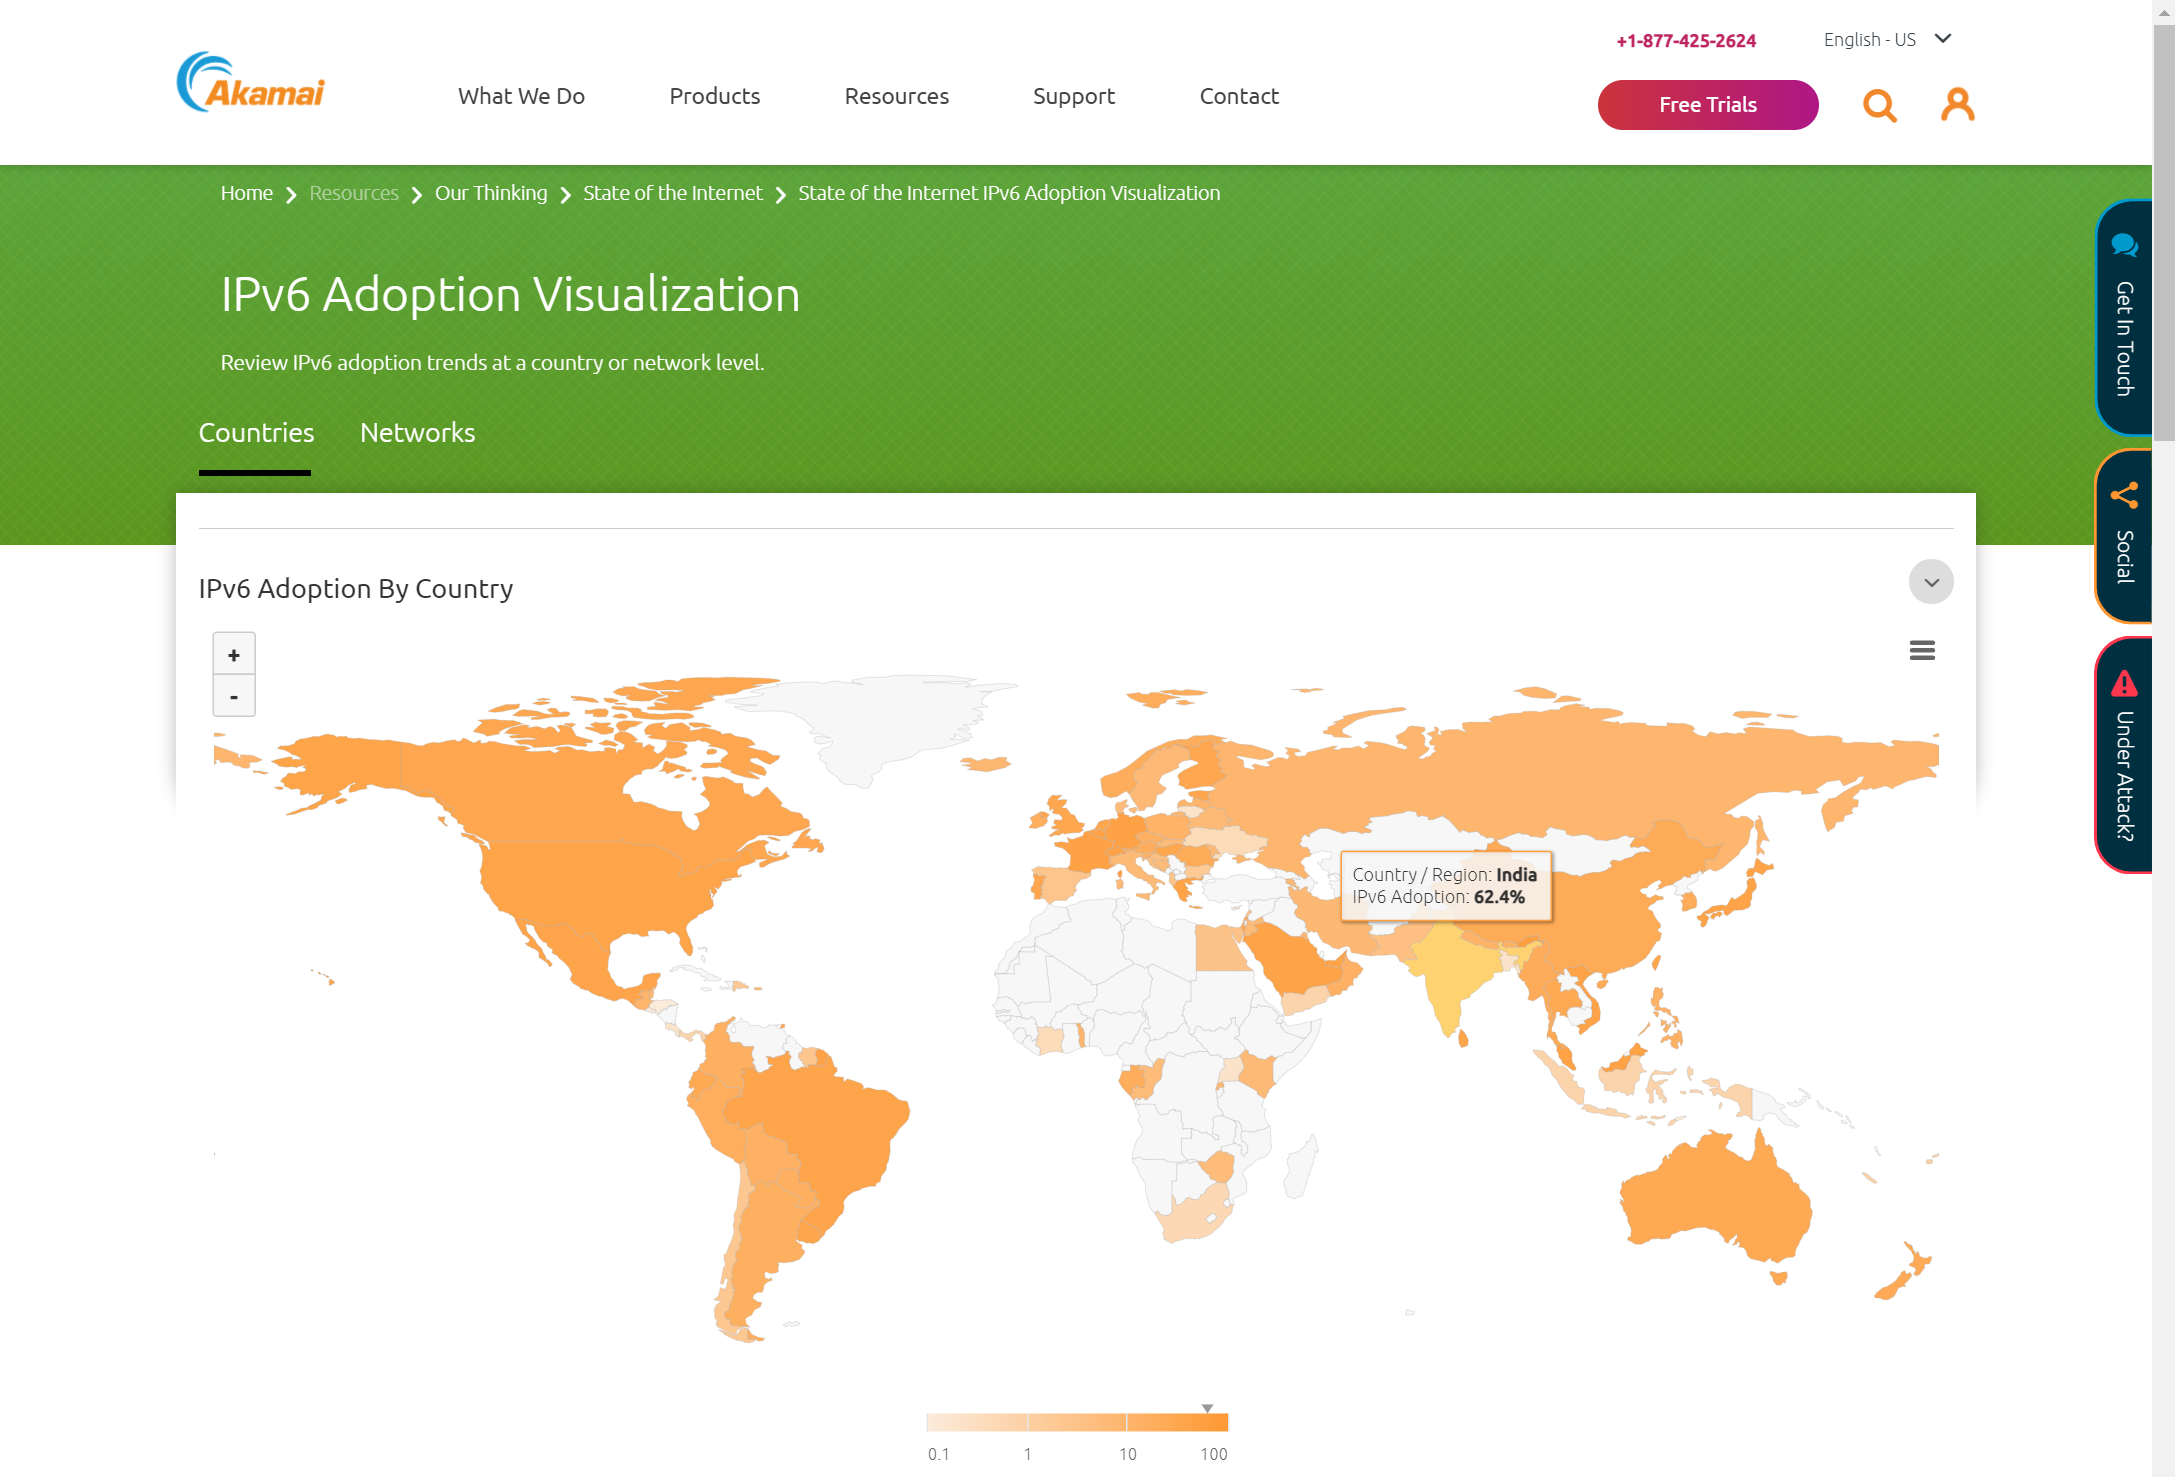
From this site we can see that there are many countries around the world with over 30% IPv6 usage. If you check this graph at different times during the week you will observe these percentages for various countries changing with the weekly Internet usage patterns.
Using Akamai’s data we can drill into a specific network’s IPv6 traffic patterns. In the chart below we selected Reliance Jio Infocomm Limited, a service provider in India, and we selected the timeframe from late December 2019 to today. We can see the periods of COVID lockdowns starting in late March to the end of April, during June, and again in August. In this graph we actually see “notches” which indicate an actual decrease in the IPv6 usage during these periods of lockdown. The reduction in IPv6 usage during COVID lockdowns could be the result of people connecting their dual-protocol mobile wireless devices to an IPv4-only residential Wi-Fi network while cloistered at home.
IPv6 Statistics Variations
Just like any scientific measurement, the values of the amount of IPv6 traffic vary widely based on where on the Internet the measurement is taken. You can see this variation in the previously mentioned Google and Akamai statistics and how they vary by country. The measurements also vary based on the organization measuring. For example, an ISP with many enterprise customers has that view of traffic measurement, compared to a Tier-1 backbone provider, or a mobile service provider, and finally a residential broadband service provider. Each will see traffic patterns and protocols based on their customer base and their focus in the market.
There was a great article published titled “IPv6 Adoption Statistics: a Comparison of Different Metrics“, by Rene Wilhelm (08 Jun 2020), which shows the variation in IPv6 usage statistics.
There is also a single page that groups the Akamai, APNIC, Facebook, Google, and Cisco 6lab stats by country.
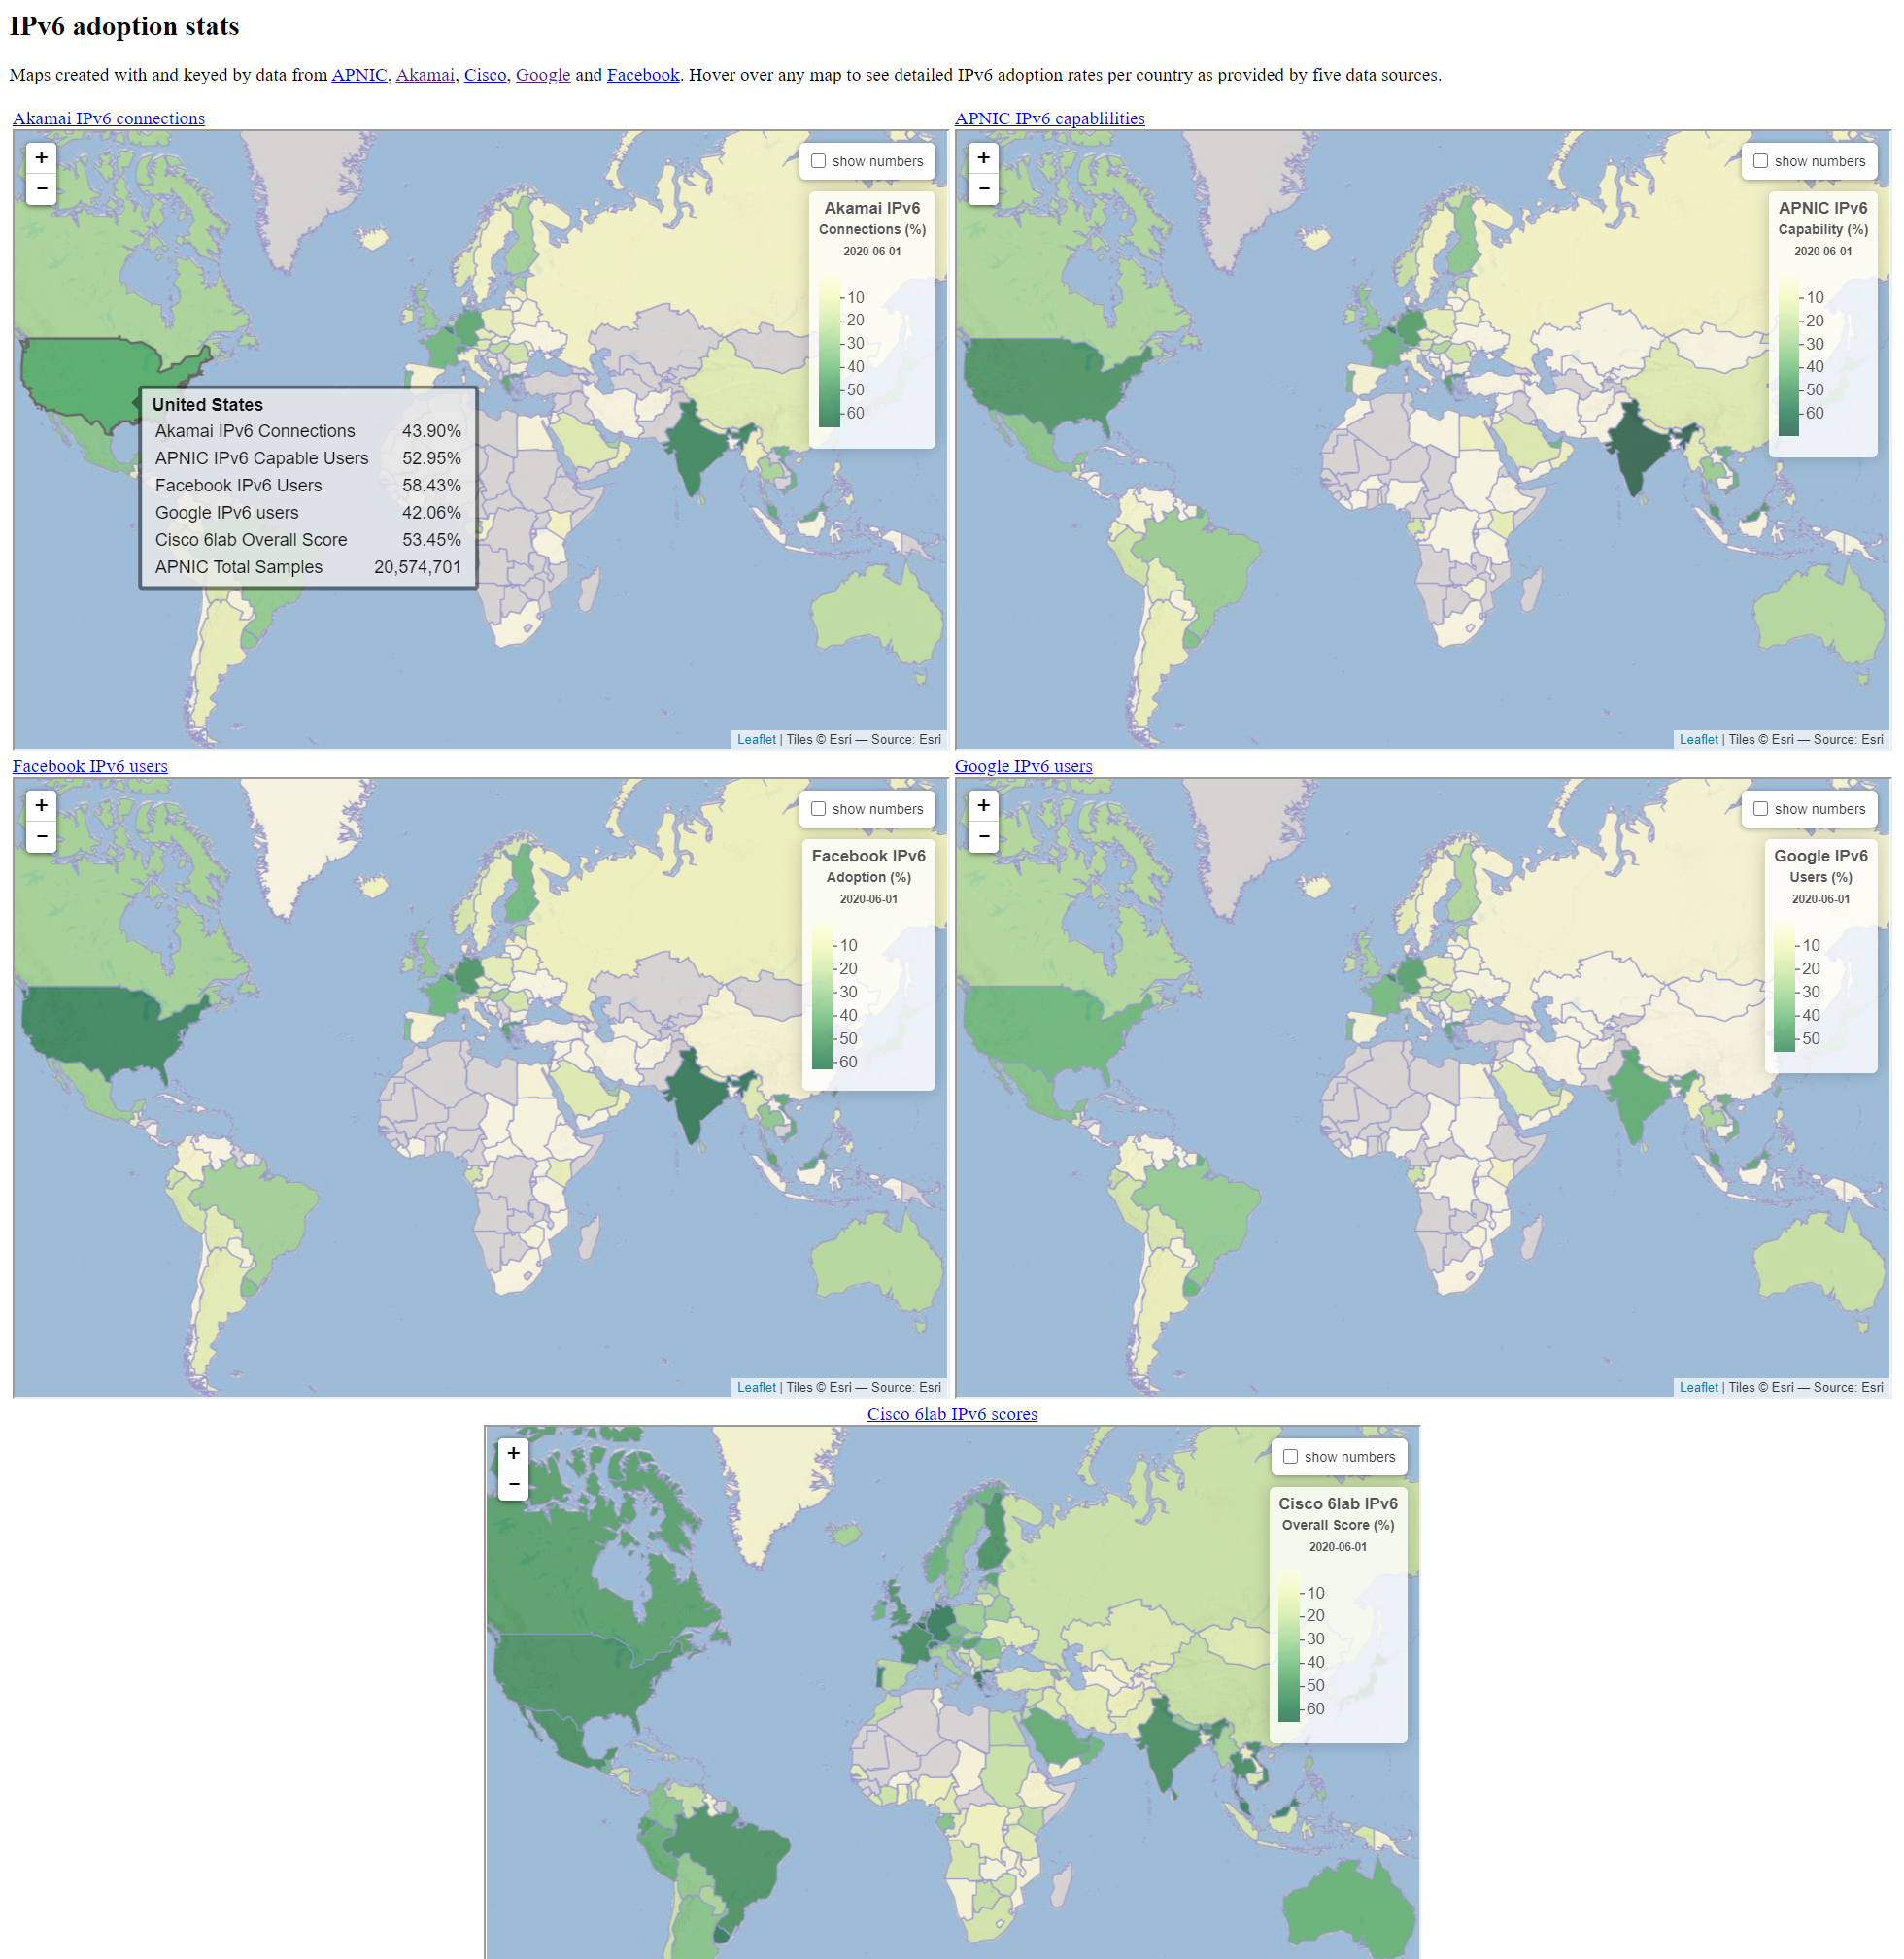
When we click on a country, we can see the different percentages of IPv6 usage from the various sources.
Diurnal IPv6 Traffic Patterns
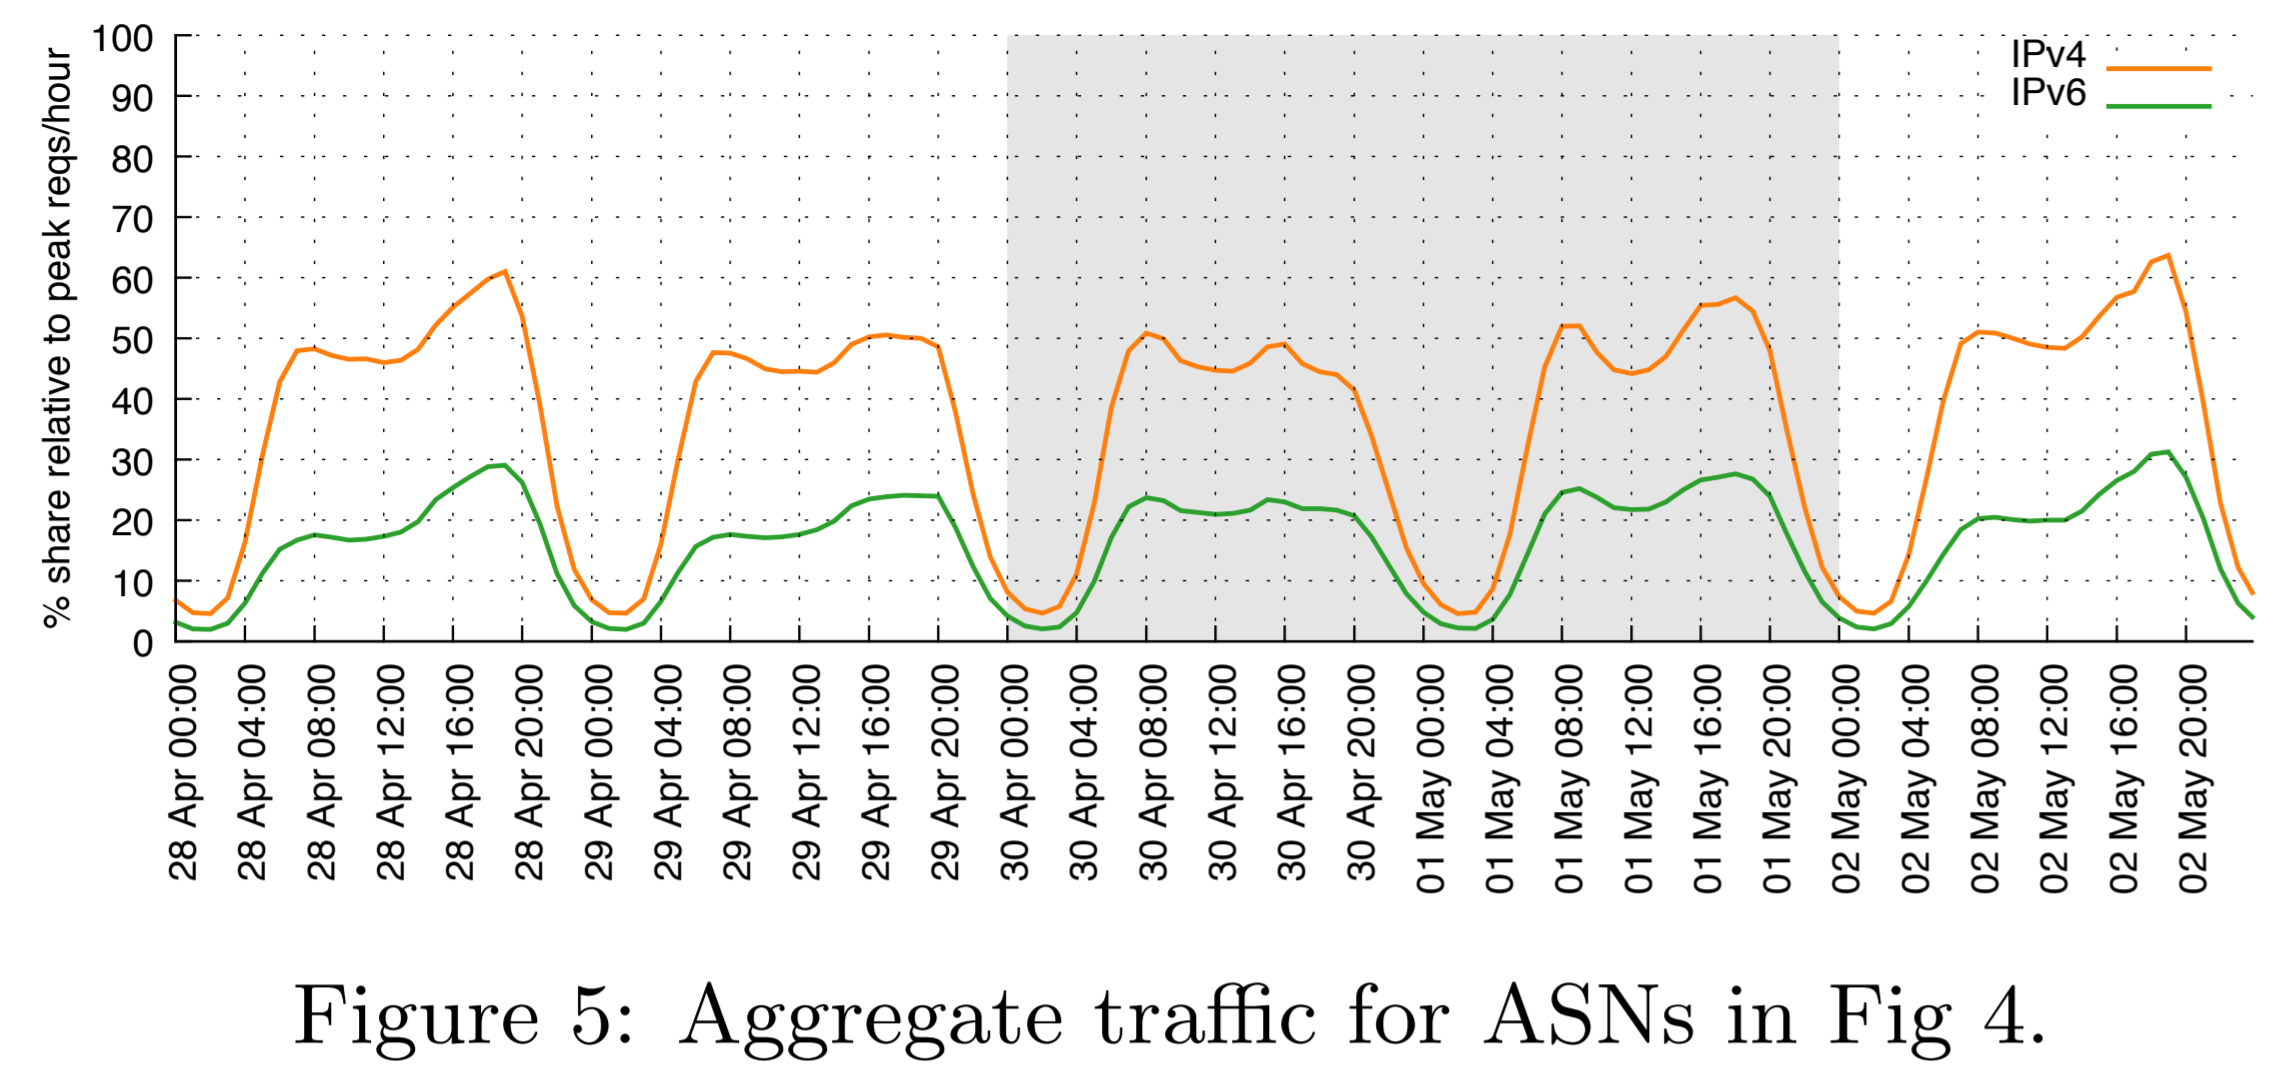
We can observe that the daily Internet traffic patterns of IPv6 and IPv4 differ, as shown in the Google statistics. This provides further evidence that the majority of enterprises have not yet deployed IPv6 because the diurnal Internet traffic pattern of IPv6 does not match that of IPv4. The IPv4 traffic volume is largest during the day when people are in the IPv4-only workplace (based on where the sun is shining as the round Earth rotates). However, we can observe that the IPv6 traffic volume tends to be larger in the evenings. This is because people are at their homes in the evening, where they have IPv6 broadband ISP connectivity, and/or they are using their mobile devices over an IPv6-enabled wireless service provider.
There was a paper published titled “Diurnal and Weekly Cycles in IPv6 Traffic“, by Stephen D. Strowes of Yahoo Inc., that showed these daily cycles of IPv4 and IPv6 traffic. The figure below “shows the aggregate behavior of these ASNs; largely, it appears that the absolute number of requests follows the same pattern between IPv4 and IPv6.” The orange line in the graph below shows the larger amount of IPv4 traffic volume throughout the day. The green line shows the lower IPv6 daily traffic volume and shows that there is more IPv6 usage in the evenings, when people are not working in the IPv4-only workplace.
Internet Exchange Points (IXPs) have enabled IPv6 (RFC 5963), and Susan Forney of Hurricane Electric recently gave a presentation on “IPv6 Adoption over Internet Exchanges“. We can also observe these similar diurnal patterns by looking at Internet Exchanges around the world and the statistics that they gather and publish. For example, the Seattle Internet Exchange (SIX) publishes public graphs of their daily IPv6 traffic volumes.
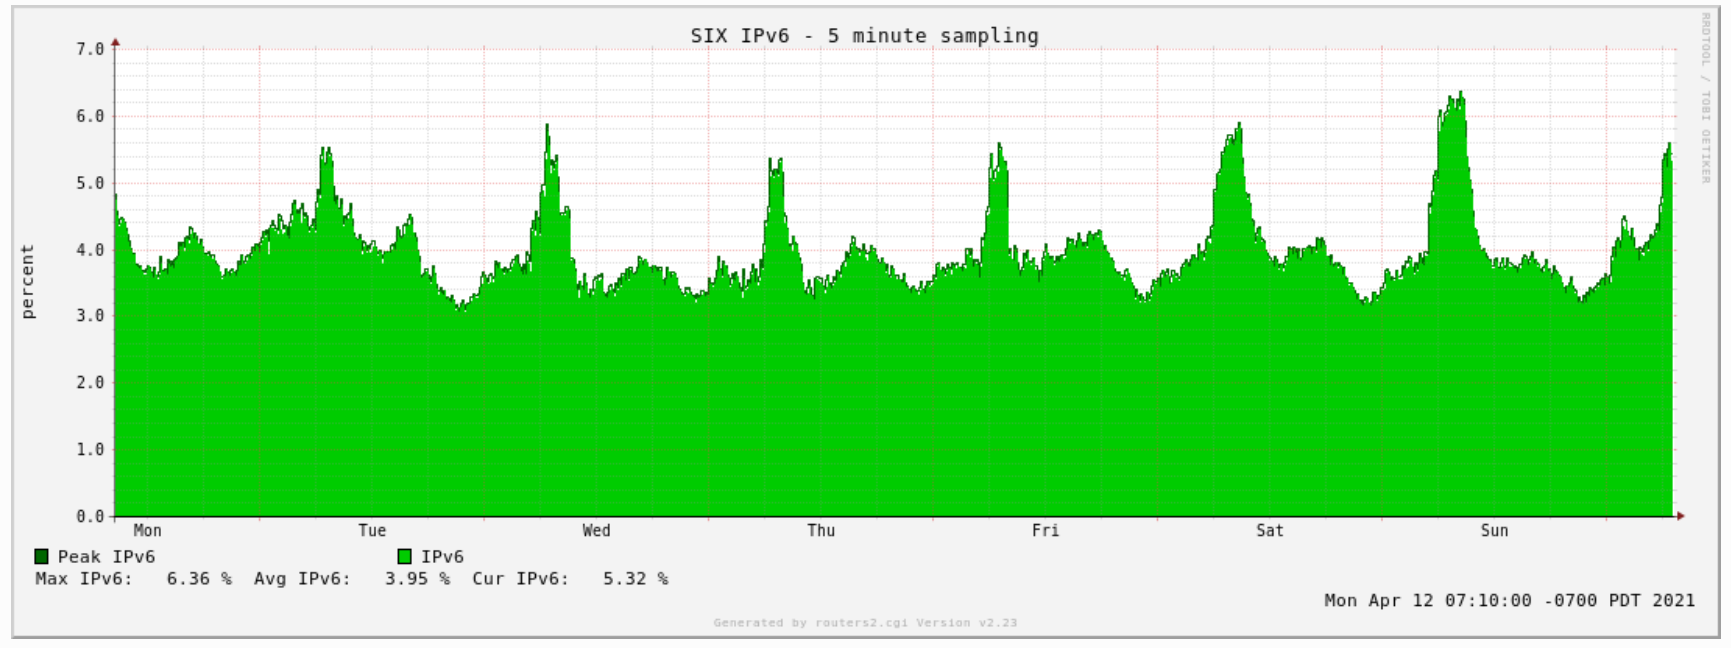
From this graph we can see that the IPv6 traffic volume daily peak time varies from the aggregate traffic volume daily peaks. We also see that these larger spikes of IPv6 traffic occur in the evening for the Asian continent. Depending on where the measurement is taken, traffic for some use cases will drop off in the evenings when people go to sleep. Regardless, there is still a difference in IPv6 usage and IPv4 usage due to the “Enterprise Effect”.
Summary
Over time, we will continue to observe greater use of the IPv6-enabled Internet. It remains to be seen if enterprises will begin to embrace IPv6 on their internal networks or if the shift toward cloud services will change the “Enterprise Effect.” We are all hoping that access to COVID vaccines, continued social distancing, wearing masks, and good health practices can help control the COVID pandemic and allow for a return to normalcy. Hopefully now, but if there are additional pandemics and resulting lockdowns in the coming years, we could see these types of fluctuations in the IPv6 Internet usage statistics.


