You are sitting on a goldmine. Your network contains a wealth of information just waiting to alert you to threats, help prioritize risks, enable forensic investigation, monitor ongoing operations, support audit and compliance, and apply analytics to plan future resources. But can you quickly view and turn that data into meaningful decisions and action?
Infoblox® NIOS 8.5, Reporting and Analytics adds three new DNS, DHCP, and IPAM usability reports to the already 100+ Splunk®-based pre-defined dashboards and reports. These new reports give you even greater visibility, usability, and value from your data. This blog provides a quick overview and shows how you can benefit from the enhanced visibility.
DNS Queries Per Second (QPS) Usage Report—Monitor DNS Queries and Quickly Resolve Anomalies
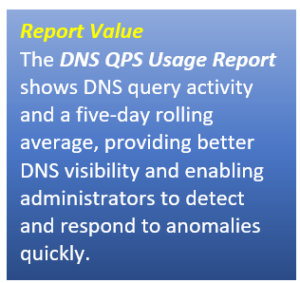
Located in the DNS Performance Dashboard, the DNS QPS Usage Report displays the five-day rolling average for the total peak DNS queries per second (kQPS) calculated for all members in the Grid.
The report displays the following in either a line chart or table format (Fig. 1).
- Time: Select a value from the drop-down list. The default value is Last 30 days.
- Line Chart: Click Line Chart to view the data in the line chart format.
- Table: Click Table to view the data in the table format.
- Both: Click Both to view the data in both the line chart and table formats.
- Show/Hide Filters: Click Show/Hide Filters to enable the filters.
The table displays the following columns:
- Date
- Peak kQPS: Maximum per day of average queries per second calculated for 10-minute intervals.
- 5-Day Average Peak kQPS: The five-day rolling average for the total peak queries per second.
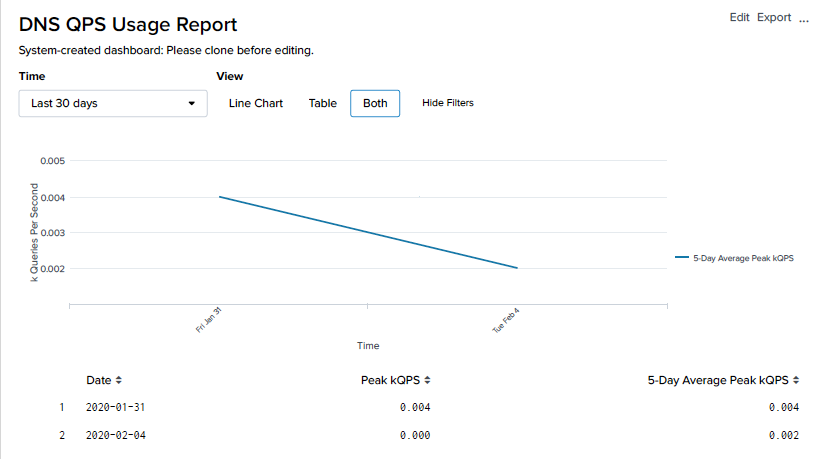
Fig. 1
Email alerts can be enabled to distribute monthly and quarterly Infoblox managed DDI services data automatically. You can also configure the DNS Usage Report, End Customer Name, and Grid License UID fields in the email message body. This report will enable administrators to stay current on the volume of DNS queries, catch abnormalities early, and take action sooner for faster remediation.
DHCP Leases-Per-Second (LPS) Usage Report—View DHCP Trends, Catch Problems and Improve Forecasting
Found in the DHCP Lease Dashboard, the DHCP LPS Usage Report shows the five-day rolling average for total peak DHCP leases per second (LPS) for all members in the Grid. It’s calculated based-on 10-minute intervals, including both leased and renewed actions.
This report displays information in either line chart or table format. The line chart shows the five-day average for total peak DHCP leases per second for all members in the Grid (Fig. 2).
- Time: Select a value from the drop-down list. The default value is Last 30 days.
- Line Chart: Click Line Chart to view the data in the line chart format.
- Table: Click Table to view the data in the table format.
- Both: Click Both to view the data in both the line chart and table formats.
- Show Filters: Click Show/Hide Filters to enable the filters.
The table displays the following columns:
- Date
- Peak LPS: Maximum per day of average leases per second calculated for 10-minute intervals.
- 5-Day Average Peak LPS: The five-day rolling average peak leases per second.
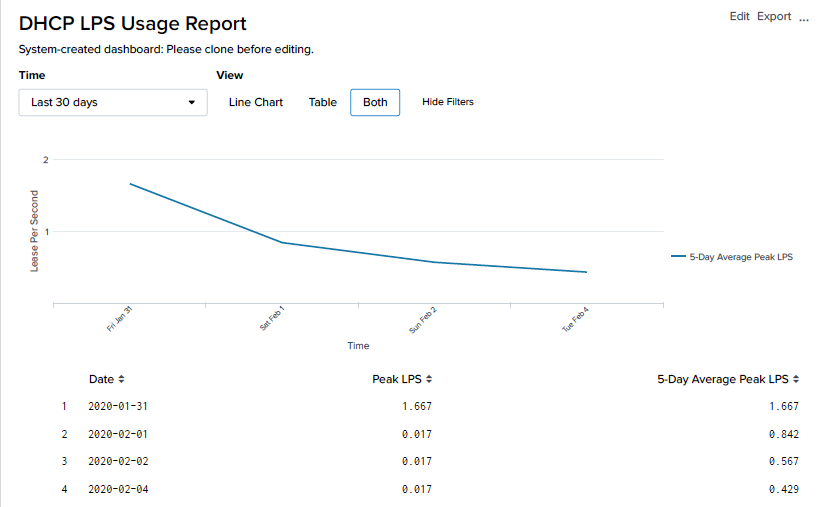
Fig. 2
Email alerts can be configured to generate monthly and quarterly Infoblox managed DDI services data automatically. You can also configure the DHCP Usage Report, End Customer Name, and Grid License UID fields in the email message body. This report gives administrators an edge in tracking DHCP statistics, spotting trends, and better planning for the future.
IP Address Usage Report—Track IP Address Utilization, Detect Issues and Strengthen Planning
Appearing in the IPAMv4 Utilization dashboard, the IP Address Usage Report gives administrators a view into daily IPv4, IPv6, and total peak usage counts and a five-day rolling average of these IP address categories across all networks in the Grid. Further, if the same network is displayed in different network views, the IP address count includes all views.
The following table identifies which IP address features are counted or not counted in the report:
| Counted | Not Counted |
| DHCP Lease | Unused addresses in DHCP ranges |
| DHCP fixed addresses | Unused addresses in reserved ranges |
| Host addresses | |
| DNS records (A, AAAA, PTR) | |
| Unmanaged addresses found by discovery |
The IP Address Usage Report displays the following information in either line chart or table format (Fig. 3).
- Time: Select a value from the drop-down list. The default value is Last 30 days.
- Line Chart: Click Line Chart to view the data in the line chart format.
- Table: Click Table to view the data in the table format.
- Both: Click Both to view the data in both the line chart and table formats.
- Show Filters: Click Show/Hide Filters to enable the filters.
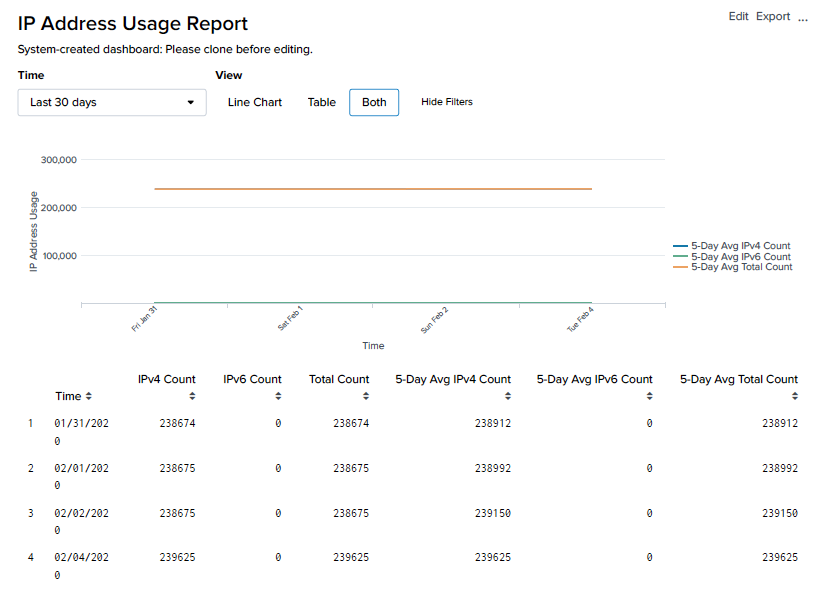
Fig. 3
The table displays the following columns:
- Time
- IPv4 Count: Count of IPv4 addresses at the time of daily peak usage aggregated across all networks in the Grid.
- IPv6 Count: Count of IPv6 addresses at the time of daily peak usage aggregated across all networks in the Grid.
- Total Count: Daily peak total count of addresses at the time of peak usage aggregated across all networks in the Grid.
- 5-Day Avg IPv4 Count: The five-day rolling average of the IPv4 count (rounded off to the nearest whole number).
- 5-Day Avg IPv6 Count: The five-day rolling average of the IPv6 count (rounded off to the nearest whole number).
- 5-Day Avg Total Count: The five-day rolling average of the peak total address count (rounded off to the nearest whole number).
Like the two new previous reports, email alerts can be enabled to distribute monthly and quarterly Infoblox five-day average of peak IP address counts automatically. You can also configure the IPAM Usage Report, End Customer Name, and Grid License UID fields in the email message body. This report helps administrators better monitor IP usage, quickly detect issues, and better anticipate future IP needs.
Together, these new reports continue the Infoblox® commitment to NIOS and customer support for real-time network visibility. Whether for audit and compliance, secure application uptime and performance, threat protection, security response, or resource planning, Reporting and Analytics can help you see and access the data you need for better network management. For a demo or more information, contact your Infoblox partner or account team.


