As architecture expands into the edge and becomes hyper-connected, it is getting more and more difficult to monitor your infrastructure. Businesses are deploying multiple applications, microservices and other facilities across the cloud, on-premises, or both. These components can begin to weave together, making it difficult to pinpoint problems or areas in need of improvement. Decision making can become ambiguous when it is done based on blurry, diluted data. It is essential to use tools that improve data clarity allowing for the effective management of your network, increasing uptime for both your employees and customers alike.
The logs generated by your environments are one of the most valuable sources of information for extracting insight into the health of your infrastructure. What is a more reliable source of information than the source itself? However, such sources can generate millions of logs, and they may be cumbersome to parse and read. Data is all over the place and is often in different formats, making it tricky to track down.
This is where log management tools such as Elastic Stack shine. You may have heard of it by its former name, the ELK Stack. Elastic Stack is a popular suite of tools that provides advanced logging, storing, searching, and visualization to data of many types from any source. According to DB-Engines, it is the most popular enterprise search engine on the market. Elastic is open-source and has been on the market for over a decade, thus gartering a hefty community of talented enthusiasts. Unlike other log management solutions on the market, like Splunk, Elastic is completely free.
Elasticsearch, Logstash, Kibana, and newcomer Beats work together to make up the core products of Elastic Stack. Elasticsearch handles search and storage of data, Logstash is the pipeline for retrieving data to send to Elasticsearch, and Kibana provides the web browser user interface used to visualize and query this data. Elastic Stack is available as a free, open source local download, but it also provides a paid-for cloud solution.
Overview
When configured, Elastic Stack can ingest data generated by the Infoblox BloxOne or NIOS platforms into Elastic. You can grab log files, data retrieved from an API, syslogs, data sent via the Infoblox Cloud Data Connector, and more. Elastic will ingest almost anything with the right configuration. However, getting it started and configured requires a bit of technical know-how.
The Infoblox Integration with Elastic Stack deployment guide is intended to provide an introduction into the power of using Elastic to enhance the rich data provided by Infoblox products. Within it you will find two separate but similar integrations: First, instructions on integrating your most recent DNS security data from BloxOne Threat Defense. Second, instructions on integrating dnstap logs from NIOS, a high performance query/response logging method. The two integrations are mutually exclusive to demonstrate Elastic’s ability to ingest all kinds of logs.
You can apply the configuration steps found in the guide to any type of data your Infoblox products provide. Simply edit the Logstash configuration files and set up any necessary configuration on the Infoblox side as needed.
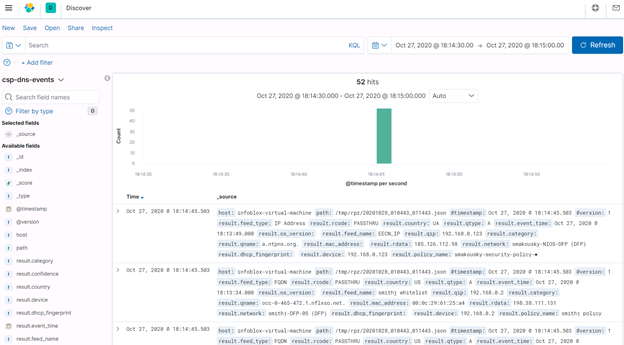
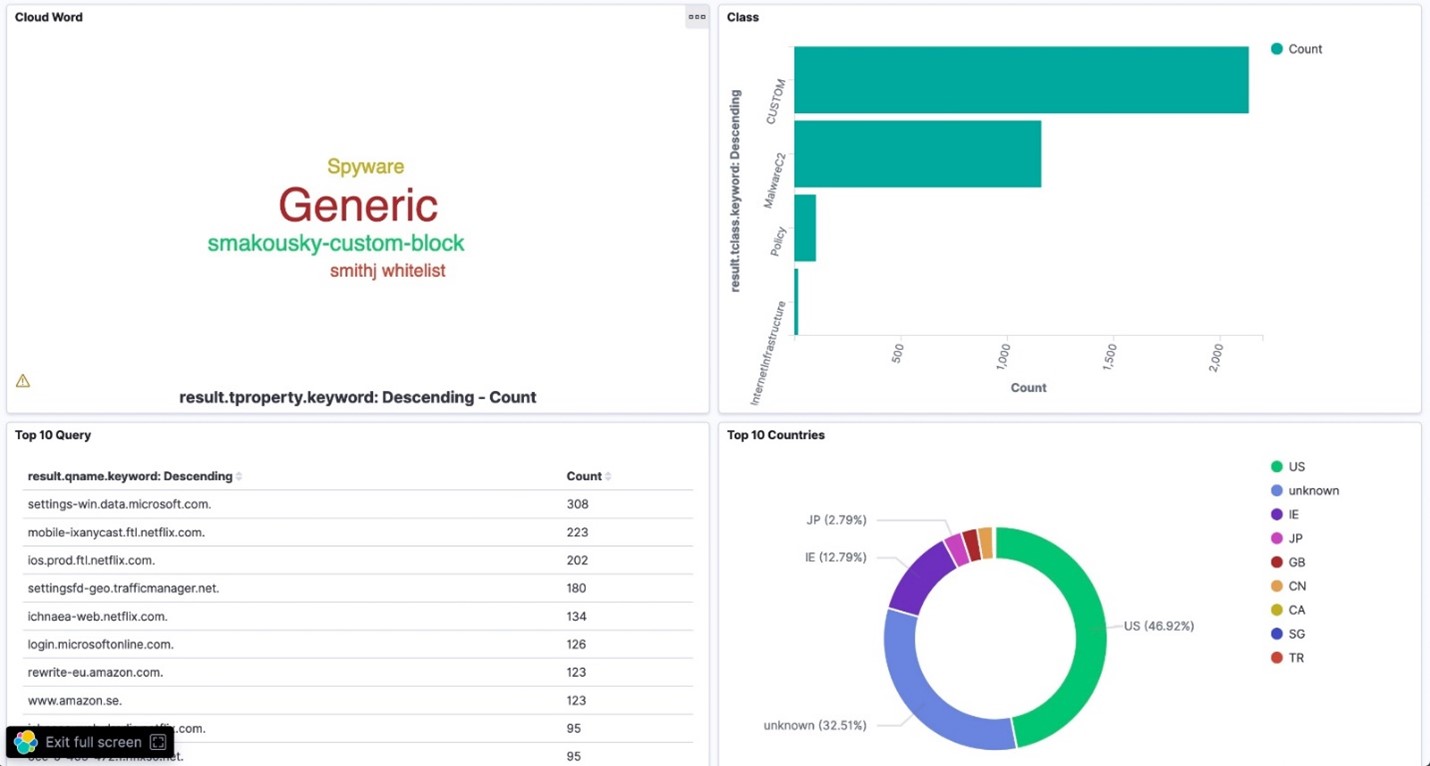
The below screenshots show some Infoblox data visualized in Kibana, the web user interface part of Elastic. See a demo video on interacting with the Kibana user interface here.


Requirements
The deployment guide is two-fold. You will need access to different resources depending on which section of the guide you wish to follow.
For integrating recent BloxOne Threat Defense DNS Security data you will need:
- Access to an Infoblox BloxOne Threat Defense subscription.
- Access to Elastic Stack.
For integrating dnstap formatted query & response logs from NIOS you will need:
- A NIOS Grid with dnstap enabled.
- Access to Elastic Stack.
- A dnstap receiver to read and translate dnstap logs from NIOS. NIOS currently has no way to store or process dnstap logs after they leave the Grid. A small Python module exists to accomplish this function.
Get to know the log management power of Elastic. Search, store, aggregate, and analyze your logs as you wish. Elastic is always evolving and coming out with updates and new features. And it’s completely free, so you can start exploring Elastic today. Happy logging!


